| Figuring Probability Fluctuations in Baseball |
|
|
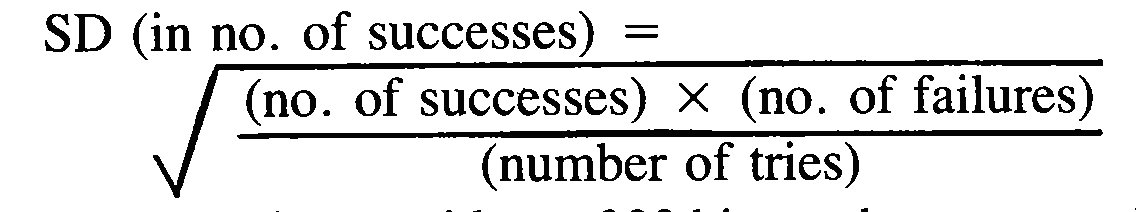
Team 9 Games Behind as Good as Champion? Maybe ALDEN MEADALL OF US ARE familiar with stories such as the following appearing in newspaper sports sections at the end of a season: Fans of our beloved Beasts are bitterly disappointed in the showing of- the team in the season just concluded. The expected neck-and-neck pennant struggle with the Toads failed to materialize, the Toads romping home a full nine games in front of our favorites. If this margin is to be made up next year, important changes in personnel are necessary, such as . . And a year later, neither team having made important changes: Fans of our terrific Toads are bitterly disappointed in their favorites' failure, not only to defend their pennant of last year, but even to make it close, losing to the Beasts by the same margin by which they won last year, nine games. Reasons for the debacle are not hard to find. Last year's batting champ, Ty Hornsby, saw his average plummet by a full 40 points, and he had to surrender his title to Rogers Cobb of the Beasts. The home-run production of Hank Ruth fell from 42 to 30, while stopper Christy Alexander's ERA soared from 2.40 to 3.00. All these stars of last year, while hardly finished as players, nevertheless appear to have lost a good part of their skills. If the Toads are to reassert themselves next year, important personnel changes are necessary, such as . . If the margin in these two races had been one game instead of nine, the stories would, of course, have been quite different because everyone recognizes that one game is too small a difference to constitute a proof of real superiority. The question ought obviously to suggest itself: Over a 162-game schedule, how far apart can two teams finish without the result proving that the higher-finishing team has really played better? Can two genuinely evenly-matched teams finish three games apart? Five? Nine? Can a batter's average rise or fall by ten points without any change in his actual skill? Twenty points? Forty? The answers to these questions are important, both to fans and researchers trying to interpret baseball statistics and to club executives trying to decide whether a player has lost his skills (or has improved dramatically), whether a major overhaul of a team is in order, etc. It appears that no one has even posed these questions in connection with baseball, much less answered them. Certainly they are not part of the routine discourse of the national pastime. Questions such as these can be answered, at least in large part, by techniques of probability theory whose use has long been routine in such areas as science, economics, opinion polling and many others. The purpose of this article is to introduce SABR members to some of the principles of these techniques, while avoiding mathematical technicalities, and to give a few results of interest for baseball as examples. To avoid keeping readers in suspense, let me say right now that the two hypothetical pennant races discussed at the beginning of the article could quite easily have taken place between two exactly evenly-matched teams. Swings such as those lamented by our fictitious sportswriters would be commonplace if one had played the seasons on a table baseball game using the same player ratings both times so that there could be no question of any improvement or deterioration in the actual quality of play. Baseball as a Game of Chance: SABR members may bristle at the heading of this paragraph. Surely our beloved game is one of skill, courage, etc., not one of chance like craps or roulette. Well, yes and no. In baseball, unlike roulette, it is possible to improve one's chances of success by such things as practice, conditioning and concentration. Like a spin of a roulette wheel, though, the outcome of any particular batter-pitcher confrontation (to take just one example) is completely unpredictable except in a statistical way. Even a tiny change in trajectory of bat or pitch, much too small to be under the control of either player, can make the difference between a line drive and a popup. By improving his skill, a hitter can increase the frequency of his hits, but he still cannot guarantee a hit in any particular at-bat. As far as we are concerned, therefore, each time at-bat must be treated as a chance event, as far as our ability to predict or analyze the outcome is concerned. Even if it is conceded that the outcome is really determined in advance by complicated factors such as the precise configuration of batter's and pitcher's muscles, etc., it would not change things as long as the analysis of these factors remains impractical. The outcome of a roulette spin is also presumably determined by the laws of mechanics, but in a way too complicated to be useful. "Chance" is just a word we use for any combination of factors too complicated for us to control or analyze. In this sense, any particular time at bat, or any particular game, is a chance event whose outcome can only be predicted statistically. An accumulation of such events, such as a team's or a batter's season record, can be treated by the same statistical methods that are used to analyze large numbers of coin flips, roulette spins, etc. In this article, it will always be assumed that each at-bat, game, etc., is an independent chance event; for instance, that a batter's chance of getting a hit is the same in every at-bat. This is close enough to the truth to give a lot of useful information, but there are at least two reasons why it isn't the whole story. First, his chances actually vary somewhat according to the skill of the pitcher, weather conditions, injuries, etc. Second, his chances in a given at-bat may be influenced to some extent by the results of his last few tries, for instance through gain or loss of confidence. With enough research and work, it would be possible to include these factors, but I'm not doing it here, and I'm quite sure that they would not substantially affect the conclusions. Fluctuations: If a coin is flipped 100 times, it ought on the average to come up heads 50 times, but in a particular try it might come up heads, say, 53 times. In this case, one says that the fluctuation, the difference between the actual outcome and what one would expect on the average, is three. Similarly, a .300 hitter ought on the average to get three hits in ten at-bats, but in a particular string of ten at-bats he might get, say, five instead, a fluctuation of two hits. What statistical theory can tell us is the size of the fluctuations, whether in number of heads in 100 coin flips or in the season record of a player or a team, that are likely to happen "just by chance," that is, without any tampering with the coin or change in the skill of player or team. The Standard Deviation: The quantity that measures the size of the likely fluctuations is called the standard deviation (SD). In all cases of interest to us here, and in virtually all where a fairly large number of events are involved, it is really all we need to know to study the likelihood of fluctuations, so that fluctuations up to about one SD are fairly common, but fluctuations much greater than that are rare. More precisely: The fluctuation will be less than one-tenth of an SD 7.9% of the time, less than half of an SD 38.9% of the time, less than .68 SD 50% of the time, less than one SD 68.5% of the time, and less than two SD 95.3% of the time. Many baseball statistics can be reduced to a series of events, each one of which can be classified as either a success or a failure. For instance, an at-bat is a success (for the hitter) if he gets a hit, otherwise a failure; a game is a success if one's favorite team wins, otherwise a failure, etc. For things like this, the calculation of the SD turns out to be quite easy. The result is:
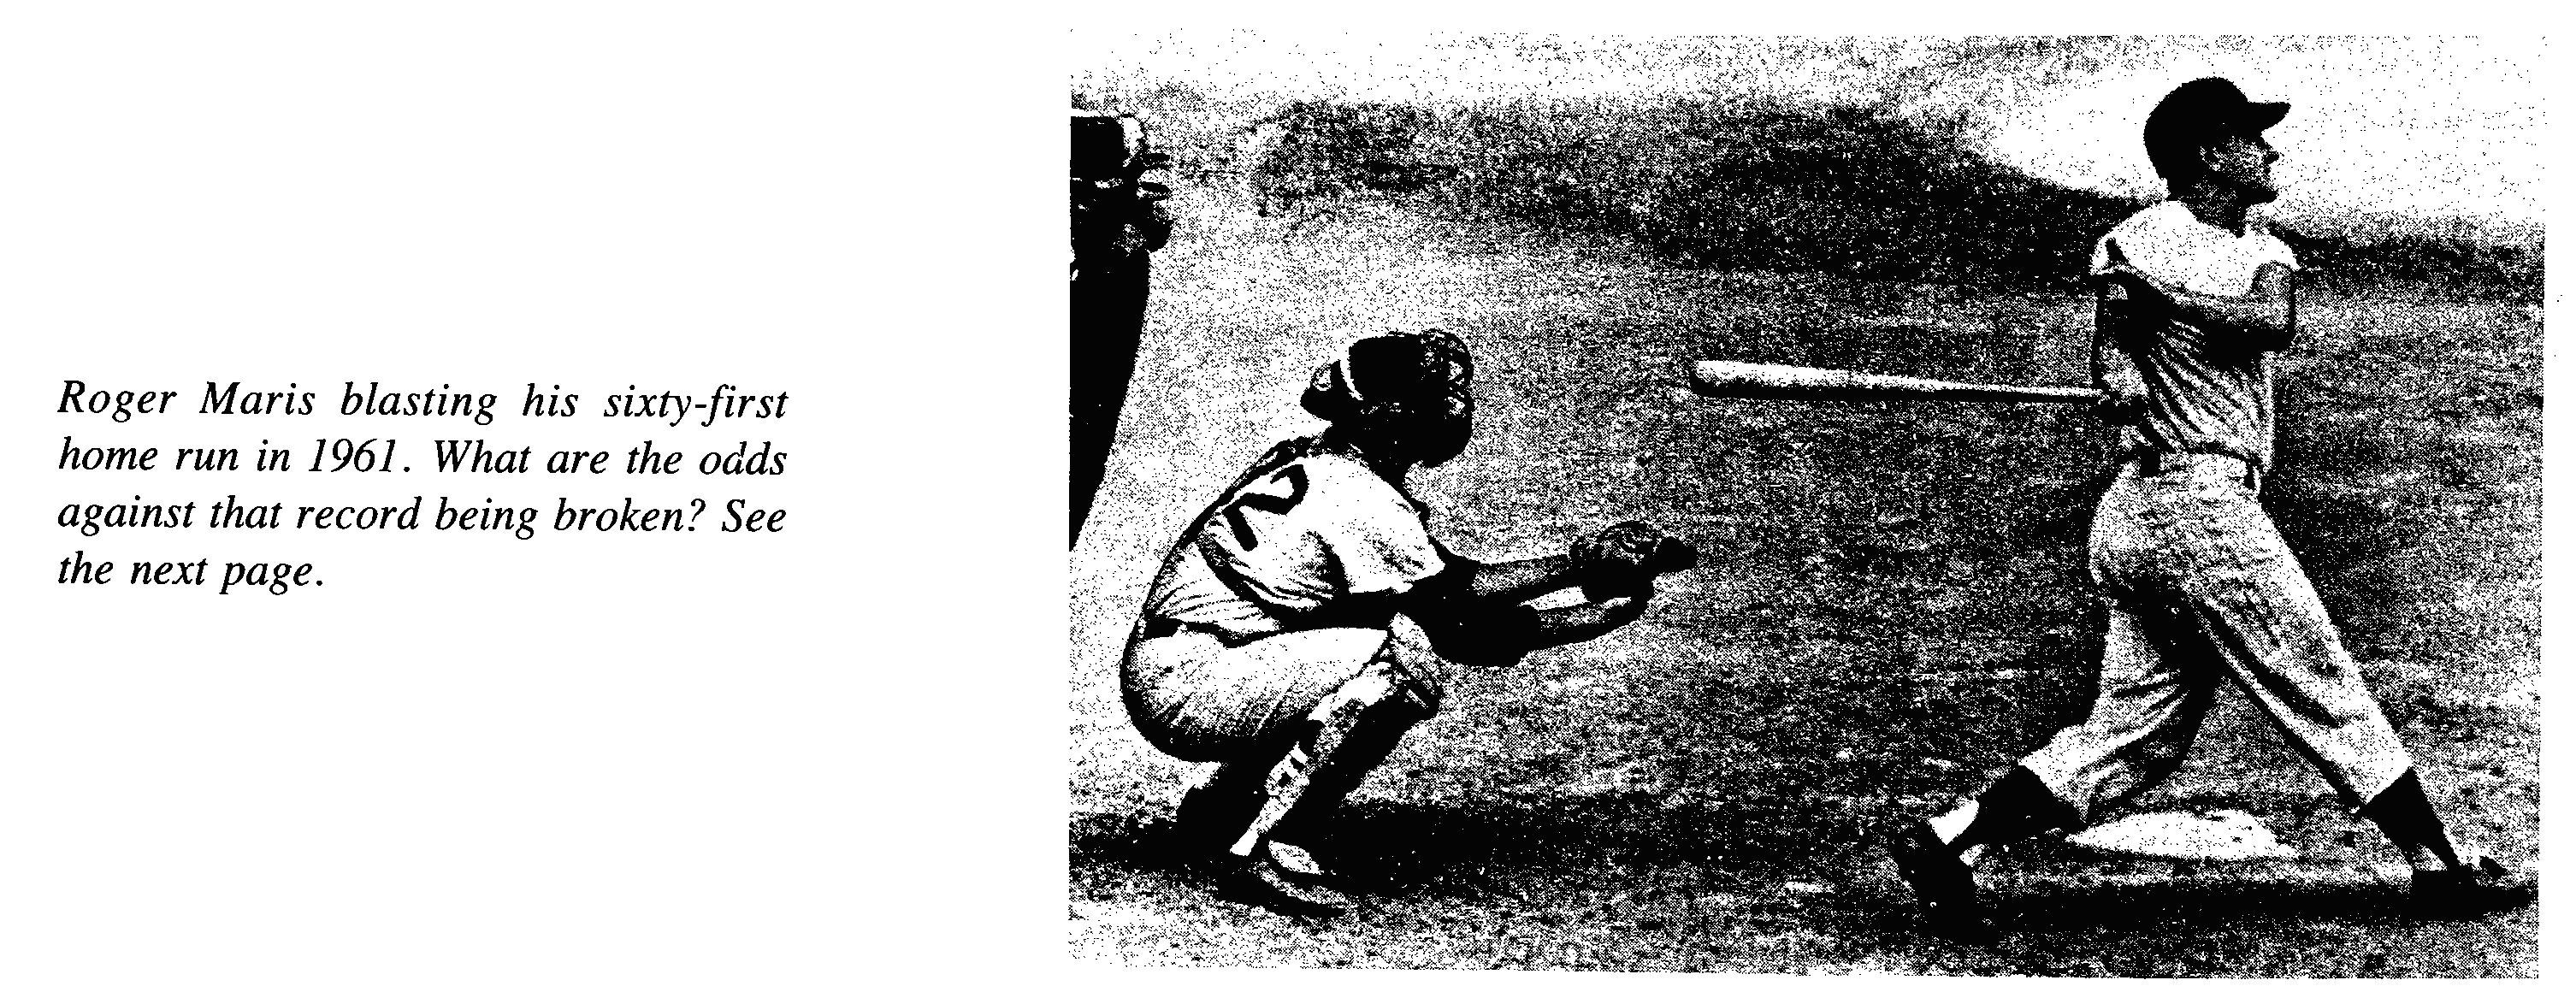
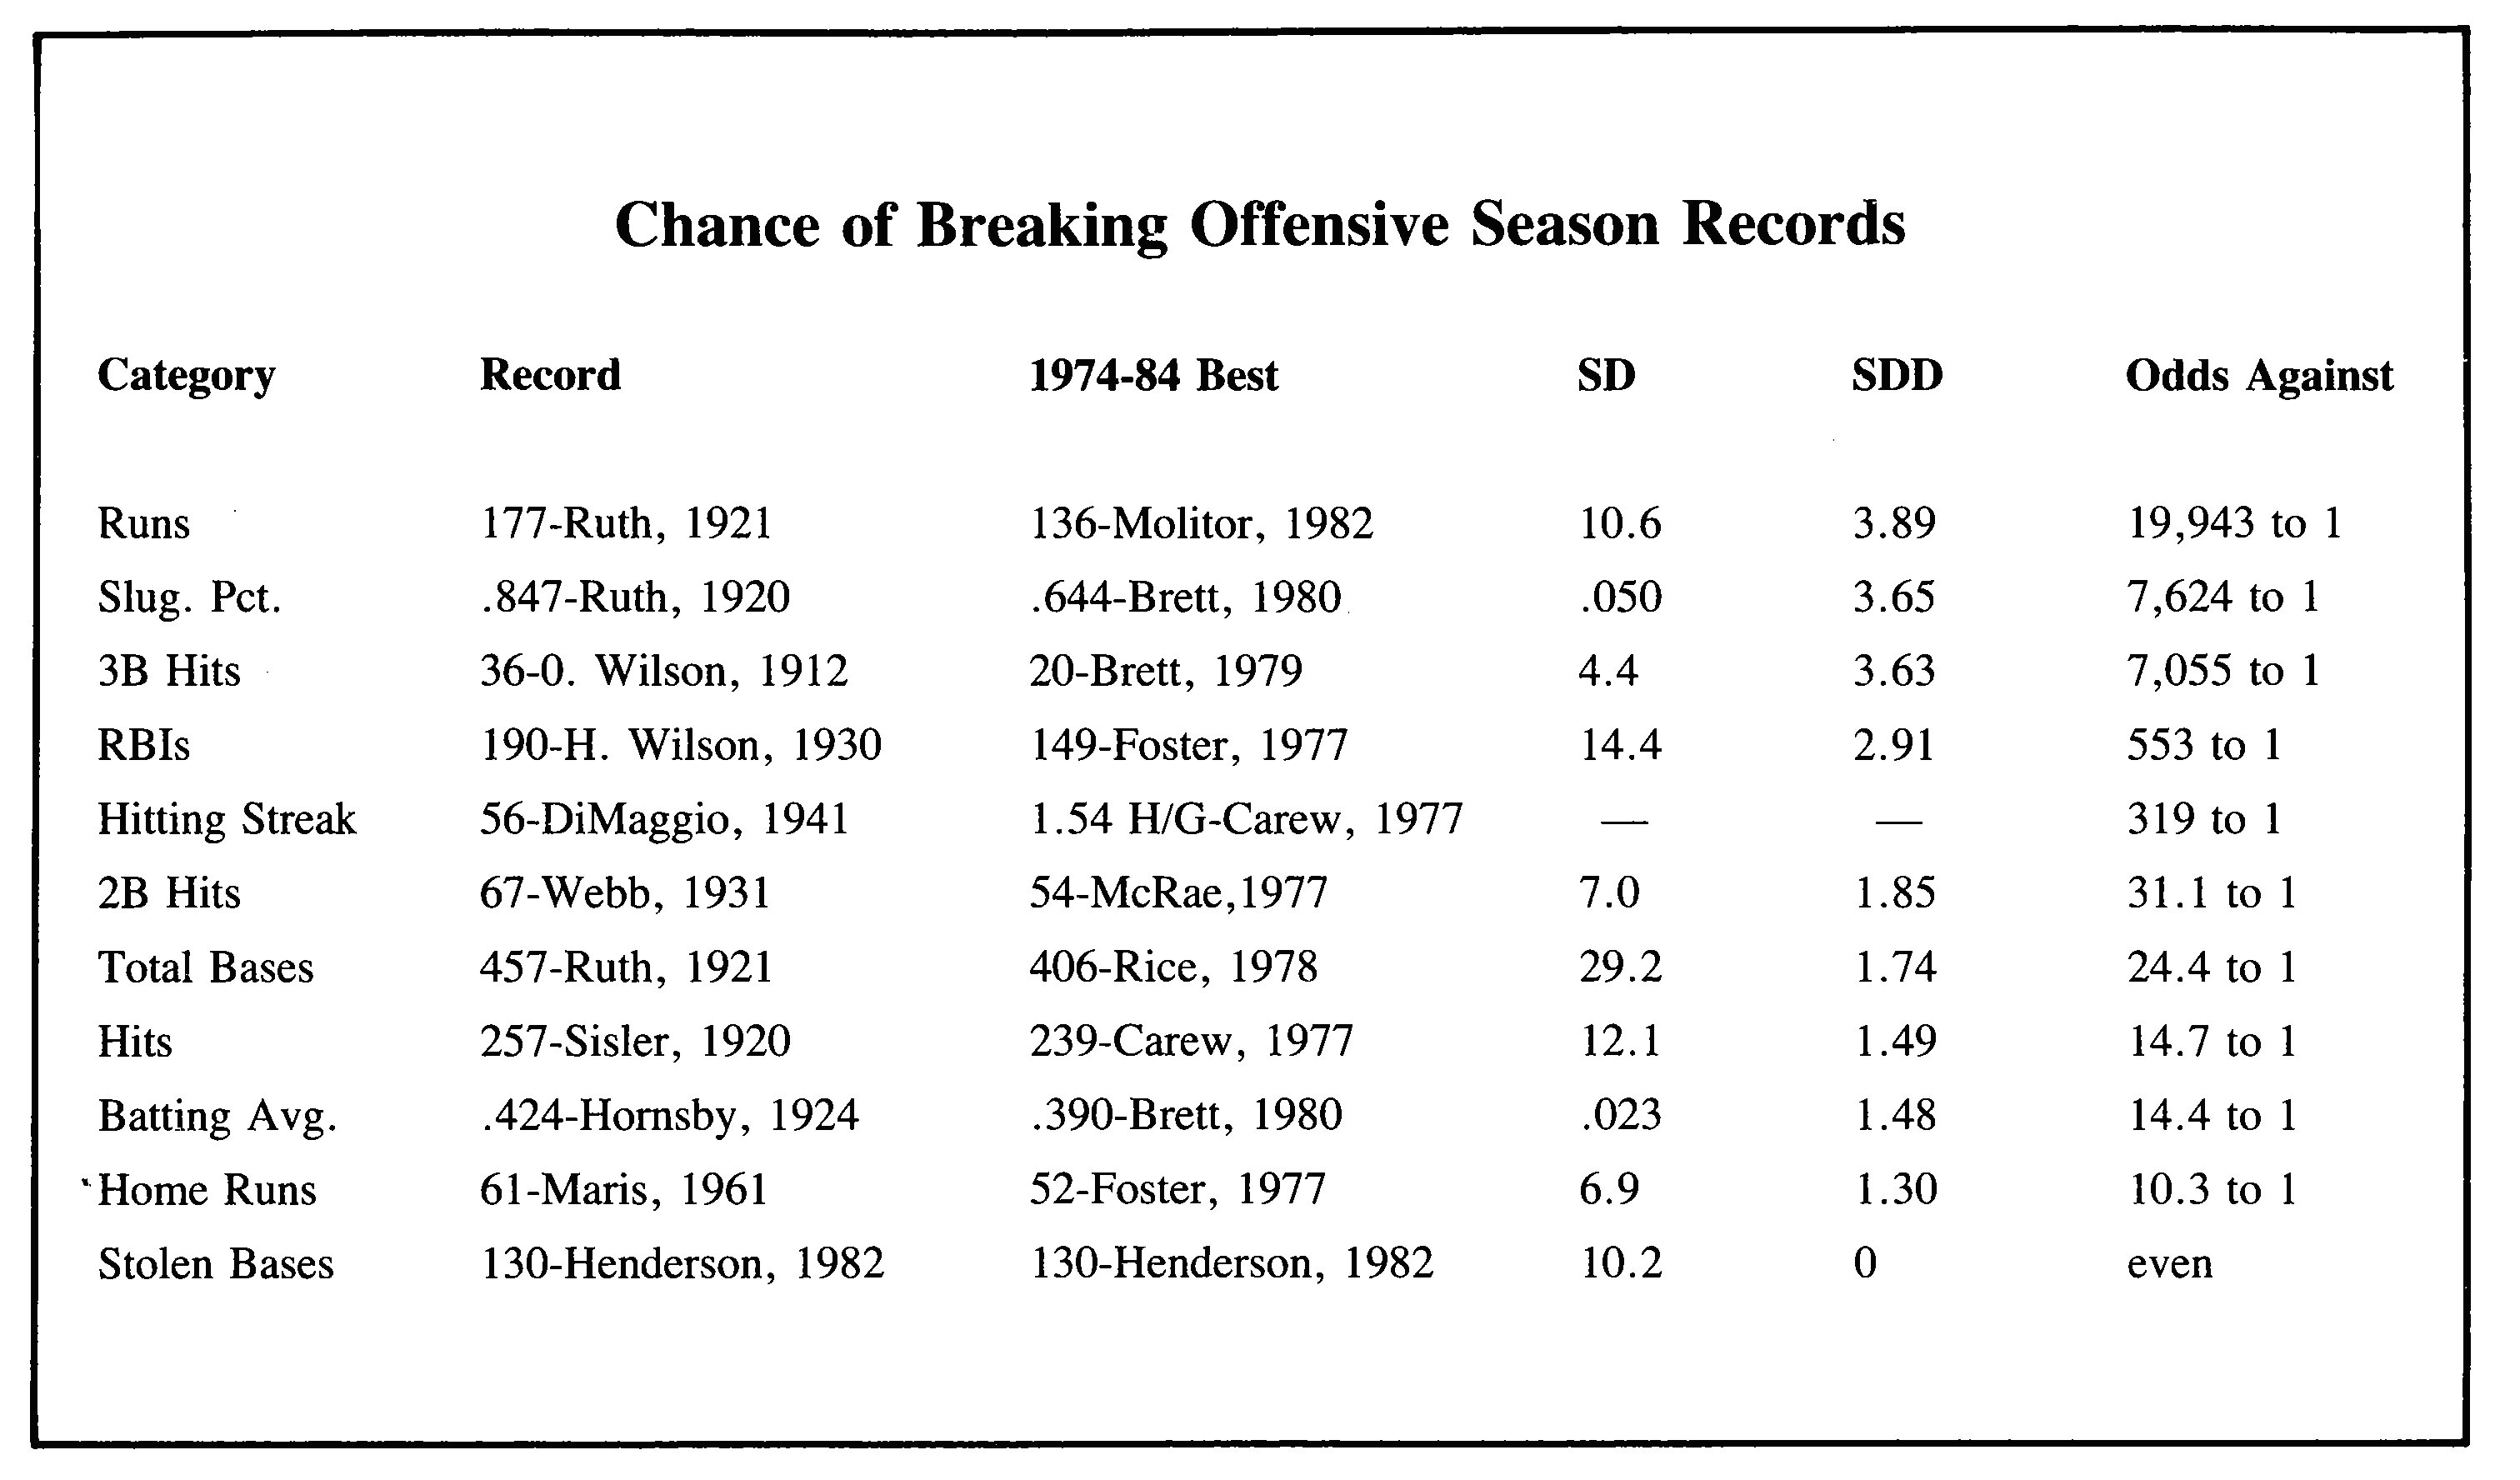
For example, consider a .300 hitter who comes to bat 500 times in a season. On the average, he should have 150 hits (successes) and 350 failures. To get the SD in the number of hits, we multiply 150 by 350, getting 52,500, divide by 500, getting 105, and finally take the square root, getting 10.2. To get the SD in the batting average, the SD in hits must be divided by the number of at-bats, 500 in this case, giving .020, or 20 points in the batting average. About 68.5% of the time, therefore, our .300 hitter will actually hit between .280 (one SD below the expected result) and .320 (one SD above). The remainder of the time he'll bat either above .320 or below .280. In fact, about 20 points is typical for the SD in the season batting average of a regular player. Note that the result would be different for a career: In 10,000 at-bats, our hypothetical .300 hitter would expect 3,000 hits and 7,000 failures. Repeating the same calculation, we get 45.8 for the SD in hits, .005 for the SD in batting average. Just as one expects, the chance of large fluctuations in the batting average gets smaller the more at-bats are taken; contrary to what many people expect, though, the SD in the number of hits actually gets bigger as one includes more at-bats. Some other season standard deviations (SD's) are: Home runs by a slugger who averages 36: 6 ERA of a pitcher with about 250 IP: about 0.30. Games won by team over a 162-game schedule: 6 Difference in games won by two evenly-matched teams (taking into account the fact that they play each other part of the time): 9 games. These fluctuations doubtless are greater than most people expect. In particular, the events described at the beginning of the article can easily be accounted for by fluctuations and would not necessarily imply any change in the actual skills of players or teams. The hypothetical changes in team standings, batting averages, home runs and ERA all correspond to fluctuations of one SD in one direction in the first year and in the opposite direction the next, something that could very easily happen if both seasons had been played with the exact same teams using a table game. If we define a regular non-pitcher as one with 300 or more at-bats and a regular pitcher as one with 150 or more innings pitched, then there are about 200 regular non-pitchers and 100 regular pitchers in a typical year. This is a large enough number that even relatively rare large fluctuations can happen a few times. In a typical year, one would expect that: About 30 regulars will have batting averages 20 points or more above what they should be; of these, about four will bat 40 points or more higher than they should. About 15 regular pitchers will have ERAs 0.30 or more below what they should be; of these, about two will have ERAs 0.60 or more below. About four teams will win six (or more) games above the number they should win. About once in two years, one of the 26 teams will win 12 (or more) games above the total it deserves. Obviously, results such as these are important for the understanding of baseball statistics. If a player's batting average in a given year is 20 points above his previous lifetime, average, it does not necessarily indicate real improvement, but could equally well be a fluctuation (owners negotiating with players' agents, please note). The same holds for all deviations from what we expect which are not much more than one SD in either direction. In particular, analyses such as the hypothetical stories with which we began this article are nonsense. Which records are hardest to break? As an example of the application of these methods, I've done some calculations which should shed some light on the perennial question of which records are hardest to break. A lot of hot air is expended arguing about this. The analysis using probability theory provides information which is certainly relevant, possibly decisive. For ten offensive categories, I've compared the modern (post-1900) season record with the best performance in the period 1974-84, omitting the strike-shortened season of 1981 so that there are ten full seasons. The best performance in a ten-year period is taken as a measure of the best that can be accomplished without fluctuation under present conditions (i.e., without a fundamental change in the game, or the appearance of a truly extraordinary player), so that further improvement must come about by fluctuation. It is then a straightforward matter to calculate the chance that a table game card programmed to duplicate the best recent performance could equal or surpass the record. The key quantity in all these calculations is what I've called the standard deviation distance, or SDD. It is just the number of SD's by which the best recent performance falls short of the record. For example, consider the category of home runs. The record, as we all know, is 61 by Roger Maris. The best total in the 1974-84 period was 52, by George Foster in 1977. Using the formula, together with his AB total for the year, we calculate Foster's home-run SD for that year to be 6.9. He was nine homers short of the record, nine divided by 6.9 is 1.30, so his SDD was 1.30, i.e., he was 1.30 SD's short of the record. Using tables which are available in books on statistics, one can find the odds against something coming out 1.30 or more SD's above what it should be on the average. The answer is 10.3 to one, and these are the odds against a player hitting on the average like the Foster of `77 reaching 61 or more home runs. Putting it another way, it is the odds against a 1977 Foster table game card reaching 61 or more home runs in the same number of at-bats. In the accompanying table are listed the modem season record, best in the 1974-1984 period, SD, SDD and odds against for ten offensive categories (hits, batting average, doubles, triples, home runs, total bases, slugging average, runs scored, runs batted in and stolen bases). The hitting streak has been included for good measure because it's often mentioned as a virtually unbreakable record. It is not susceptible to the SD approach, but the odds against can be calculated. For the best in 1974-84 in the hitting streak category, Rod Carew of 1977, who had the most hits per game during the period, was chosen because a high hits-per-game total gives the best chance of a long hitting streak. In using the formula for SD, the stats for the player best in 1974-84 were used, with that player's actual number of successes and failures. Each time at bat was considered an attempt in all categories except runs scored, RBI and stolen bases. For these, each plate appearance was considered an attempt. For total bases and slugging average, the SD's for singles, doubles, triples and home runs had to be calculated and combined. For RBI, the number of plate appearances resulting in two or three RBIs had to be estimated, the SD's calculated, and these combined. For stolen bases, the possibility of one plate appearance leading to two or more stolen bases was ignored. Because the best performance in a category in a ten-year period is probably itself a fluctuation, my values for odds against are probably conservative, but the rankings should be about right. Looking at the table, some readers may find some surprises, while others may just find previous opinions confirmed. For me, there was a little of both. The records divide themselves pretty well into four classes: First, the records for runs, slugging average and triples, for which the odds against are several thousand to one, may to all intents and purposes be considered unbreakable under present conditions. They could only be endangered by some basic change in the way the game is played (such as a rule change greatly favoring the offense) or by the appearance of a player so extraordinary that he simply can't be judged by the same standards as even the greatest stars of the present (Babe Ruth in his day may have been such a player). The records for RBIs and hitting streak, with odds against of a few hundred to one, are hard to break, but there is a slight chance if a player has a really outstanding season and also enjoys a large fluctuation. Then there are five categories with the odds well under 100 to one, for which the chances of breaking might be rated as fair. It would not be too surprising if one of these records were to fall within the next decade. Finally there is the record for stolen bases, which was set during the 1974-84 period and is thus by definition vulnerable to an outstanding player of that period. The case of stolen bases emphasizes, however, how a change in the way the game is played can affect the vulnerability of records. If this same calculation had been done in 1940, about the time I first really began following baseball, a different situation would have been encountered. The record for stolen bases then was 96 held by Ty Cobb. The best total in the 1930s was 61 by Ben Chapman in 1931. His SD was 7.45, and his SDD was 4.70, making the stolen-base record at that time even tougher to break than the runs scored now! And indeed, as long as managers' attitude toward the stolen base remained as it was in the `30s, Cobb's record was virtually untouchable. Now the game is played differently, players like Rickey Henderson are eagerly sought and given the green light, and there is no guarantee that the present record will last long. It is my hope that this article will stimulate interest in the use of probability theory in the analysis of baseball statistics because I think it can provide a lot of useful information. Much work remains to be done, but it certainly can be done if a few people become interested in this (to me, at least) fascinating area. |