ONE OF BASEBALL'S GREATEST attributes is that it is, at the same time, both an individual game and a team sport. Because of this, baseball lends itself to unsurpassed recordkeeping. The pitcher-batter confrontation and its subsequent hitter-fielder conclusion enables baseball to be broken down into statistical "cells" to an extent unequaled in any other team sport. These statistics fuel everything from the creation of intelligent strategies by statistically-minded managers to competitive trivia among fans (as well as radio and television broadcasters). Thus baseball statistics have both a practical usefulness as well as a general fascination for those who love the game.
Surprisingly, one of the most pervasive statistics in baseball has historically been overlooked: the effect of the count on the probabilities of a hit, walk, strikeout, etc.
One of the factors contributing to this historical neglect is that it is virtually impossible to go back into history and reconstruct such data from past eras. As a result, comparative statistics are essentially precluded. The only serious attempt to study the impact of the count was performed by Pete Palmer and summarized in The Hidden
Game. Palmer's study was directed primarily at determining run values for each count; thus, many valuable subsets of data were consolidated beyond the point where they could be reconstructed to answer other equally interesting questions.
Despite the difficulty of obtaining an historical base for a major analysis of the effect of the count, a study restricted to contemporary games can still be useful for many purposes:
1. It can be useful to managers and/or catchers in determining strategies under certain circumstances, such as the advisability of throwing a "cripple" on the 3-0 pitch, the use of a pitchout on a certain count, etc.;
2. It may help managers evaluate the relative effectiveness of the current pitcher by comparing his percentages to a "norm" and removing him when his statistics fall below a predetermined level of effectiveness, rather than after the damage has been done; and
3. It may be useful for evaluating pitchers (and perhaps batters as well) in terms of statistics other than the usual W-L and ERA numbers, especially for general managers seeking to trade for a quality pitcher whose current record may be understating his true long-term probable value.
Through the wonders of technology (i.e., the videotape recorder), it was possible to create a data base of more than 3,200 plate appearances and more than 11,000 pitches by using games broadcast through June 7 of the regular 1986 season. Most of these games, due to the location of the author, included either the New York Yankees, New York Mets or the Philadelphia Phillies, but a number of nationally broadcast "game-of-the-week" telecasts were included as well. Thus a relatively reasonable random sample of pitchers and batters was obtained.
On the off-chance that a 3,200-appearance sample might still produce a biased result due to an over-representation of the three "local" teams, all statistics were checked against league averages over the same period and were found to be well within statistical bounds of significance. Thus there is every reason to believe that these statistics represent "real-world" probabilities for major league baseball.
All plate appearances were tabulated on a pitch-by-pitch basis and separated into statistical cells from which averages and probabilities could later be tabulated. As in the Palmer study, intentional walks, sacrifice flies and sacrifice hits were excluded from the final data base.
These exclusions may be responsible for a marginally lower-than-average percentage of walks compared to league statistics, but should have no other effects. In addition, the insignificant number of batters hit by pitched balls was also excluded from the data base.
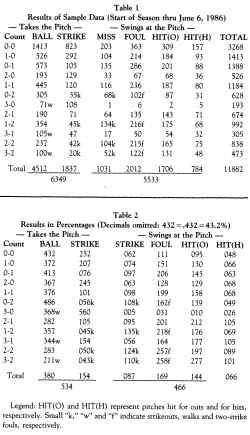
Every pitch was tabulated first by the count on the batter and then by the result of the specific pitch (ball, called strike, swinging strike, foul ball, hit for out, hit safely). Thus every pitch was placed into one of 72 cells 12 different possible counts on the batter and one of six possible results.
In addition to the overall analysis, separate analyses were performed on two subsets: (1) bases empty, and (2) runners on base. Since sufficiently large subsamples of both exist, valid conclusions can be drawn concerning differences in pitcher/batter performances in these circumstances. More detailed breakdowns (e.g., runner on first only), while perhaps desirable, could not be achieved reliably with the sample size used. Moreover, the difference between runners on base (pitcher usually in a stretch position) and bases empty (full windup) seems to be more substantive than, say, runner on first vs. runners on first and third.
ONE FINAL NOTE on methodology: No provision was made for results which were not recorded in the games themselves. An apparent fielding error that was ruled a hit by the official scorer is recorded as a hit; a pitch a full foot wide of the plate, yet called a strike, is recorded as a called strike.
If any single unexpected revelation came as a result of the data-gathering portion of this study, it is that baseball is as much a pitcher-batter-umpire game as it is a pure pitcher-batter game at the plate. While it is not possible to prove it through the type of statistics which the study recorded, my observations convinced me that umpires are more prone to call marginal pitches strikes, in the last two innings of a game than they are in earlier innings.
Why this happens is not entirely clear. Perhaps umpires feel a psychological pressure to end the game and transfer that pressure to the batter, letting him know that he had better swing at any pitch which is reasonably close; from my own experiences umpiring both softball and baseball many years ago, this reasoning is not too far-fetched.
The overall results of the study, without regard to the number of runners on base, are shown in Table 1. To make this data somewhat easier to interpret, each item has been converted into percentage terms in Table 2.
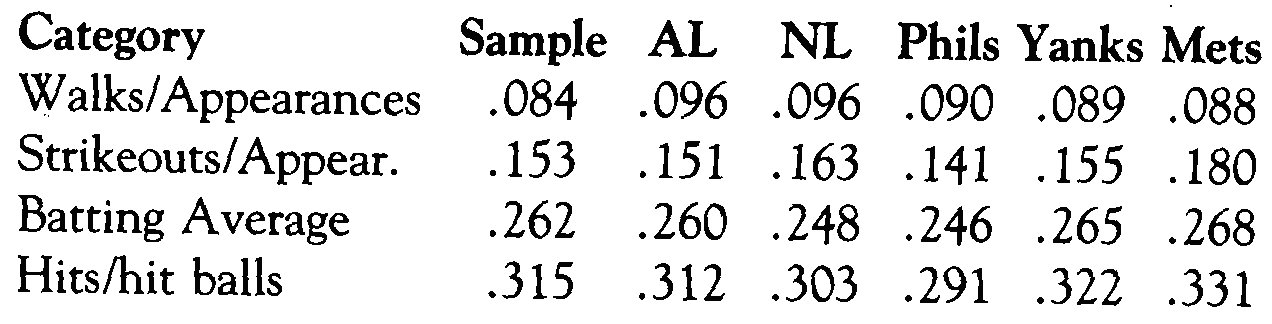
A comparison of the sample results with league averages during the study period (start of 1986 season through June 6) follows:
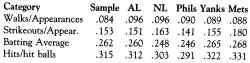
As the figures above demonstrate, the results of this sample are reasonably close to the general performance of all teams during this period in terms of percentage of strikeouts, batting averages and hits per hit balls. As noted earlier, the lower-than-average base-on-balls percentage stems partly from the exclusion of intentional walks in this study and partly from the fact that the three pitching staffs most represented in this study gave up significantly fewer walks than the league as a whole (187.6 per team as contrasted to 170, 162, and 161 for the Yanks, Mets, and Phils, respectively). With this single caveat, there is no reason to reject the sample data as unrepresentative, and analysis of the results can proceed.
In analyzing the results, certain statistics seem to stand out especially strongly. The following comments relate to some of the most interesting of these.
MISSED SWINGS. Perhaps the most striking statistic is the extraordinarily low percentage of swung-on pitches which are missed completely. Fewer than one out of every five swings is missed completely; about 45% of swings produce either a hit or an out, and the balance (3 6%) are fouled off. One marvels at the skills of major league batters to make contact so consistently and also at those pitchers who are able to strike out ten or more of these batters in a game.
TAKEN PITCHES. Further testament to the extra-ordinary "eye" of the major league batter is his apparent ability to discern a good pitch from a bad one. While there is no way to record the number of bad pitches swung at, the statistics do show that on those occasions when the batter chooses NOT to swing, he is right (i.e., the pitch is called a ball) about 71% of the time. If this is true of the AVERAGE player, imagine what the skill of a Ted Williams must have been!
CALLED VS. SWINGING STRIKEOUTS. At the earliest stages of almost every player's introduction to the game, it is axiomatic that he will be told to "never take a called third strike"; yet more than 28% of the strikeouts recorded in the sample were called third strikes. This is a statistic which is hard to accept at face value (especially since only 29% of taken pitches are called strikes, regardless of the count), although every subsample confirms this result. The implication would be that a batter's ability to "protect the plate" does not improve much when he has two strikes on him.
IN FACT, that appears to be the case. The percentage of pitches fouled off of pitches swung at remains consistently between 33% and 40% for all counts on the batter. And the highest percentage - 40% - is for the 0-1 pitch.
Despite the statistics attesting to the high ability of batters to discern good pitches from bad ones, it would appear that many marginal pitches are being let go and are resulting in called strikeouts. This may be a prime example of the "umpire factor" at work - perhaps the umpire feels a need to punish the batter for not swinging at a pitch close enough to the strike zone when he has two strikes on him, thus giving the pitcher the benefit of the doubt.
THE 0-2 PITCH. The aforementioned inability of batters to improve their ability to protect the plate with two strikes on them makes questionable the cherished notion of using the 0-2 pitch as a "waste pitch." And the statistics bear out this questioning of the "book." In those instances with an 0-2 count when the pitcher put the ball close enough to the strike zone to compel the batter to swing at it, the batter struck out 24% of the time! This compares quite favorably with the overall 19% swing-and-miss rate for all counts.
In addition, on those occasions when the batter watched the 0-2 pitch go by, more than 10% were called third strikes. Considering that some portion of these tosses were "waste pitches" anyway, there seems to be reason to believe that a pitch somewhere near the strike zone has a reasonably good chance to be given the benefit of the doubt by the umpire. In any event, this area definitely deserves more detailed research.
THE 3-0 PITCH. The fact that almost 60% of all 3-0 pitches are taken for a called strike should probably not be surprising. What WAS interesting, however, was the wide difference observed in the percentage of batters swinging at the 3-0 pitch (14 of 193, about 7.3%) compared to the Palmer study of all World Series games played between 1974 and 1982 (66 of 336, or 19.6%)! Can it be that World Series managers are likely to give a green light to a batter on a 3-0 pitch almost one out of every five times, when they do so about one time in 14 during the regular season? Since both studies eliminated intentional walks from the data base, there is no reason to assume a statistical bias one way or the other.
Moreover, the divergence of the data does not end merely with the frequency of swinging at the pitch; the results of those swings are significantly different as well. Palmer reported that of the 66 World Series players swinging at the 3-0 pitch, 34 missed it completely! This is a staggering 51.5% miss rate, higher by far than any sample at any count under any condition. In contrast, the 14 swings in this study produced only one complete miss, six foul balls and seven balls put into play.
While both samples are admittedly too small to draw any conclusions with confidence, the results of the current study are at least compatible with what has been observed for batters in general. This extraordinarily wide divergence of observed behavior in the regular season vs. World Series play certainly deserves closer scrutiny.
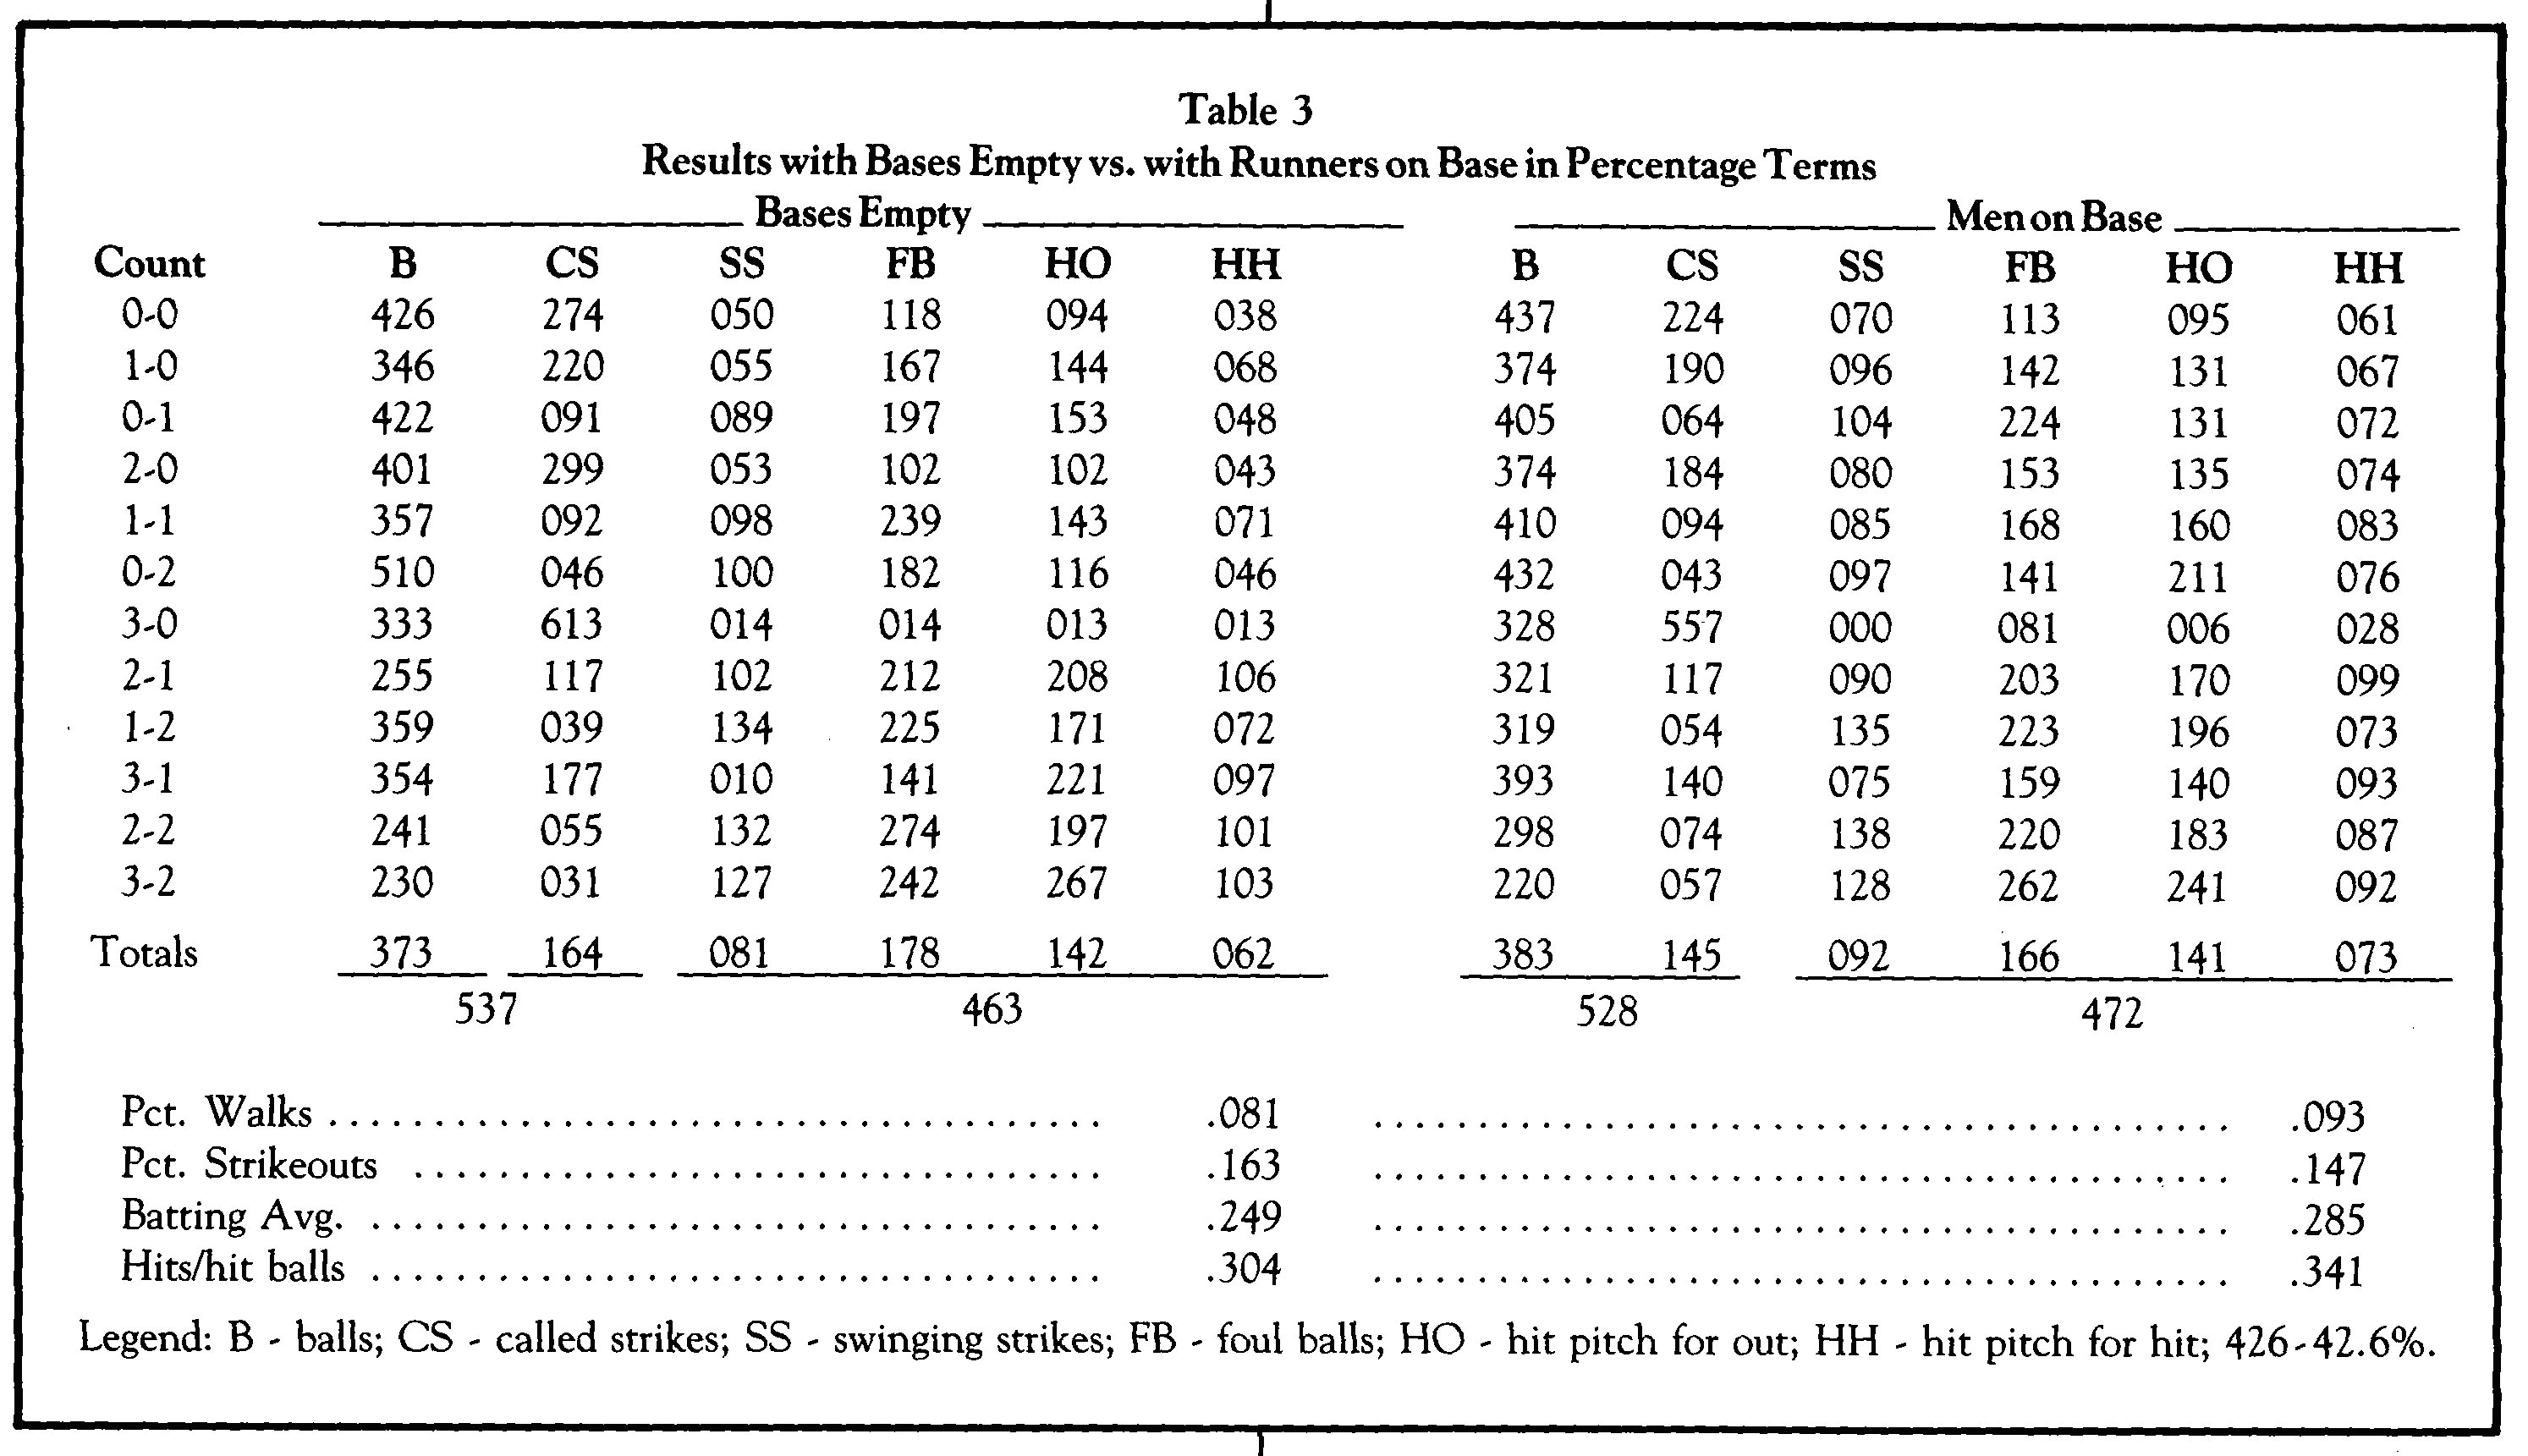
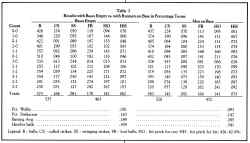
BASES EMPTY VS. RUNNERS ON BASE. While it should be expected that significantly different patterns exist when there are runners on base and when the bases are empty, the extent of those differences was surprisingly large. Batting averages with runners on base were .036 higher than with bases empty (.285 vs .249), and the strikeout rate was only 14.7% compared to a bases-empty rate of 16.3%
It is not difficult to postulate reasons why this should be so. With bases empty almost all pitchers throw from a full windup (a few relievers, such as Kent Tekulve and Jim Winn, throw exclusively from the stretch), which should produce a marginally faster pitch to hit. Also, since a hit is relatively more dangerous than a walk with men on base, a catcher is more likely to call for curves, knucklers, etc., which are more likely to be outside the strike zone but are also less likely to become base hits; he is not as apt to ask the pitcher to "challenge" the hitter. Unfortunately, this often leads to the pitcher falling behind in the count, which, combined with the stretch position, creates a situation generally more favorable for the hitter. And as the data show, the batters tend to respond with a vengeance.
Using the same graph procedure as earlier, converting all figures into percentages and putting the two charts side by side, we come up with Table 3, which readily shows the differences.
WHILE THE explanation suggested would justify a higher-than-average walk rate and a higher-than-average batting average when there are runners on base, the data suggest that there may be some problems with it. If, in fact, pitchers are more likely to avoid "challenging" the batters until they have fallen behind in the count, we should expect the average number of pitches thrown per batter to be higher with men on base than with bases empty. Oddly enough, exactly the opposite is the case; pitchers averaged 3.70 pitches per batter with bases empty and only 3.54 pitches per batter with men on base.
These numbers seem to fly in the face of the almost 15% higher walk percentage with men on base. One possible explanation might be that with men on base, when good pitches come in batters are less likely to let the opportunity go by, and the average number of pitches before a ball is hit would be lower. Plausible, perhaps; but again, not backed up by the evidence. The take/swing ratio with men on base is only marginally higher than for bases empty, and the percentages of hit balls per swing are virtually identical.
Is there any real significance to all this, or are these just "fun" statistics, fascinating to the baseball statistician but having no real-world application? While there may be no obvious way to put this information to use, the figures indicate several tendencies on the part of both pitchers and batters that might be put to use in a particular situation.
For example, the knowledge that a batter is significantly more likely to swing at the first pitch with runners on base may be useful to a catcher in determining his pitch selection. Similarly, the fact that with runners on base a much higher percentage of batters are called out on the 1-2, 2-2 and 3-2 pitches than with bases empty may indicate a psychological bias on the part of umpires to give the pitcher the benefit of close ones with men on base; a good catcher could probably use such information to his advantage. While some catchers probably know such things intuitively, statistical evidence is almost always more useful than a pure hunch.
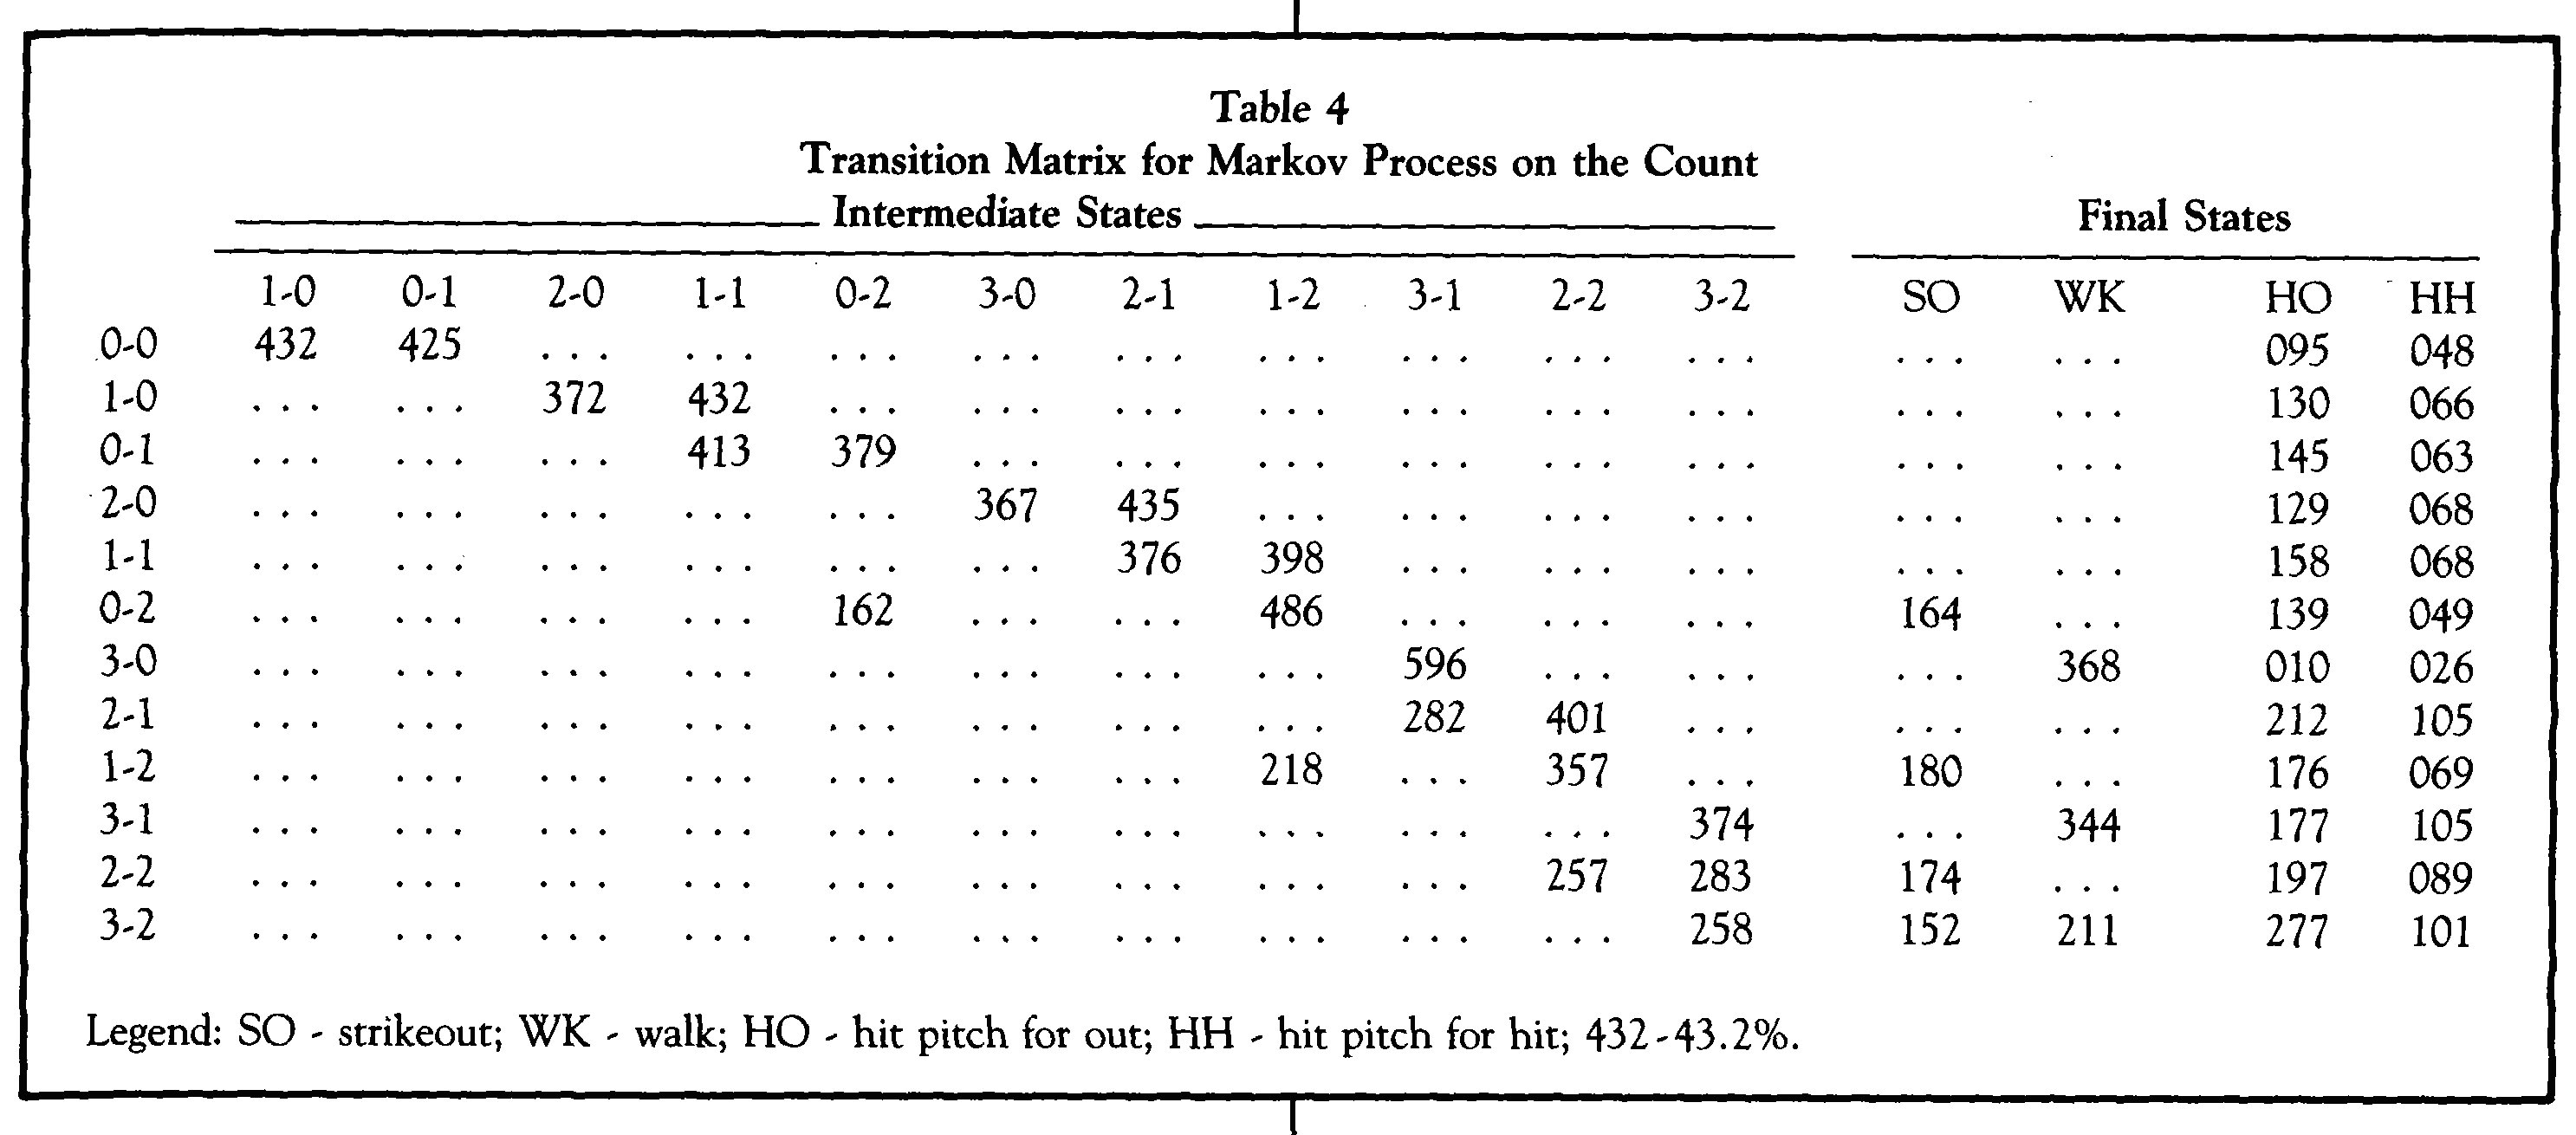
THE PROCESS followed by a batter can be described very precisely in statistical terms: (1) Each turn at bat must end in one of a finite number of possible outcomes; (2) in the process of arriving at one of those final outcomes, the batter may or may not pass through a finite number of intermediate states; and (3) the probabilities of entering any intermediate state or final outcome from any other intermediate state can be estimated by experiment.
This may sound complicated, but it really isn't. Every batter starts with an 0-0 count. His turn at bat ends when he reaches one of four possible outcomes: strikeout, walk, hit for an out or hit for a hit (remember, sacrifices, hit by pitch, etc., have been eliminated from the sample survey). In the process of achieving one of those final outcomes, he may go through any of 12 different possible intermediate states from an 0-0 count to a 3-2 count. And each of these probabilities can be determined from the sample data collected.
For example, the probability of a walk or strikeout on a 1-1 pitch is obviously zero; but the probability of going to 1-2 from there is .101 + .098 + .199 = .398 (called strike + swinging strike + foul ball). On a 2-2 pitch one can either strike out, go to 3-2, hit the ball for either a hit or an out, or stay at 2-2 (foul ball); the probabilities of all these events can be quantified from the earlier charts.
Given these conditions we have enough information to calculate probabilities relating to the overall sequence in a hitter's turn at bat. The statistical tool used is called a Markov Process. Readers interested in the mathematical aspects of Markov chains and Markov processes are urged to read any number of good statistical texts on the subject.
For the less mathematically inclined, the only numbers of importance are the input matrix (probabilities of going from any one state to any other) and the output (probabilities of getting to any final state from any intermediate state, including the original one). The input matrix, culled from the probabilities in Table 2, is shown in Table 4. Starting from any count in the column on the left, the probability of reaching any other state on the next pitch can be found.
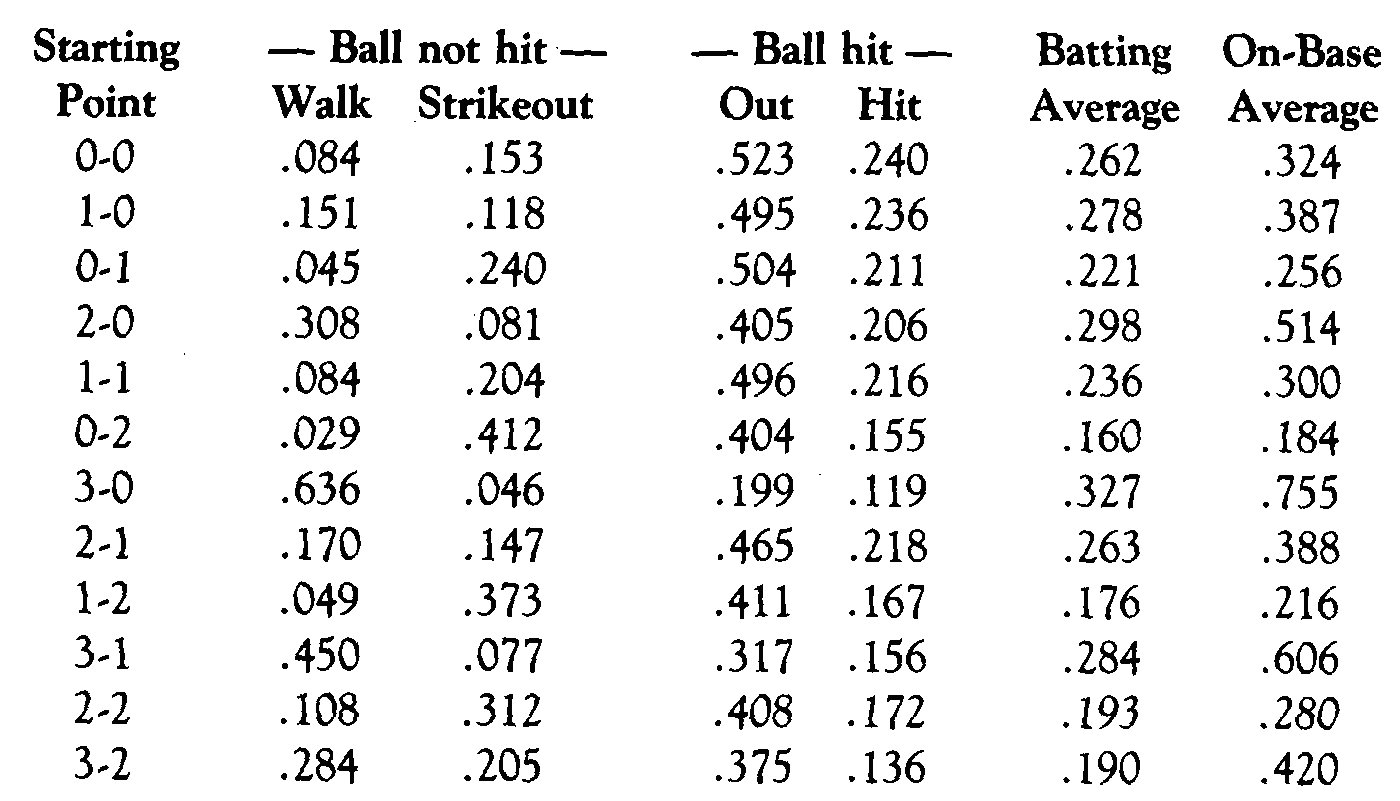
When the matrix in Table 4 is incorporated into a Markov process and calculated on a computer, the following expectations or end results starting at any particular point in the count are produced:
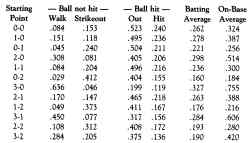
The last two columns, estimated batting average and on-base average, do not come from the Markov matrix itself but are calculated from the results of the first four columns. Because of this, the on-base average understates the "true" OBA as it is normally construed, since it
ignores hit batters, reaching base by error, intentional walks, etc. This modified OBA provides a useful measurement for comparing the expectations at different points in the count, however, since it includes all those situations in which the batter's action contributes to the result.
The results clearly indicate the truth of many baseball homilies regarding the value of staying ahead of the hitter. Of the 11 possible counts other than 0-0, the batter has an advantage over his initial expectations on only four of those counts: 1-0, 2-0, 3-0 and 3-1. The 2-1 pitch can be considered a "neutral" count for all practical purposes, and the 3-2 pitch, while producing a probable batting average of only .190, does have a .420 OBA expectation due to the .284 probability of drawing a walk. All other counts are distinctly favorable to the pitcher.
Interestingly, the expected batting averages compare extremely well with those calculated by Palmer in his World Series study, with two notable exceptions: the 0-2 count and, once again, the 3-0 count. Palmer's study indicated a .198 BA for hitters passing through the 0-2 count; the Markov process indication, .160, is considerably lower. Contrarily, the Palmer study showed only a .250 BA for the 3-0 count, while the Markov process predicts a .327 BA. Coupled with the strange results reported earlier when comparing the Palmer study of the 3-0 pitch with the data from this study, it is not surprising that there is a significant difference in expected batting averages on this pitch. It is not clear why the 0-2 count produces such divergent results.
One of the wonderful problems of the computer age is that almost every time a new area of study is opened as a consequence of the ease of data collection and manipulation, the results almost always suggest new areas for further research. This certainly appears to be the case here. If large enough data samples could be gathered, we could see how the probabilities shift under conditions of none, one or two outs; how probabilities shift as a function of how many batters the pitcher has already faced in the game; or even how specific batters alter the odds by swinging for the fences or going for pure contact, or how certain types of pitchers (e.g., knuckleballers) produce different patterns.
As INDICATED more than once in this article, there is at least a possibility that subconscious influences on the umpire may affect his calls in certain situations. I'm not quite sure how to set up a study to test this hypothesis, but believe it would produce wonderful controversy and, perhaps, even add to our knowledge of the role which psychology plays in the game of baseball.
With the data-gathering techniques available today, only the patience of the researcher and the limitations of the imagination would appear to be inhibiting factors to a research explosion on the study of the most fundamental part of baseball - the plate appearance itself.