| Average Pitching and Fielding Skills Through Major League History |
 |
 |
|
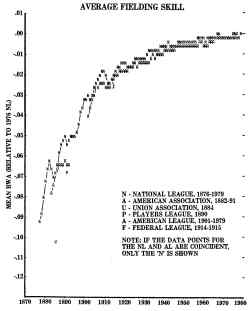
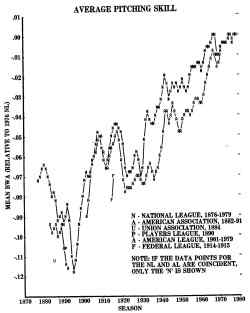
By Dallas Adams The 1980 Baseball Research Journal included a very intriguing article by Richard D. Cramer, "Average Batting Skill Through Major League History". In that paper, Dr. Cramer developed a means by which batting performances in difference years could be compared. The article, which was concerned only with changes in batting skill, generated some controversy. However, if the thesis of Dr. Cramer is accepted as valid, then his findings on changes in batting skill can be utilized to derive, to a first approximation, the corresponding changes in average major league pitching and fielding skills. These will be approximate, not exact; for the method will determine the annual average levels of pitching and fielding skills in combination with the effects of rules changes, variations in the baseball and certain random factors (e.g., the weather) which might be present. Luckily, the changes in pitching and fielding skills can be isolated from these other influences to a certain extent. Random factors like the weather and small year-to-year variations in the quality of the baseballs will rarely be the same in two consecutive seasons. Hence, their effects can be minimized by determining average pitching and fielding skills over a two- or three-year period. Unfortunately, the influences of the switch from the dead ball (pre-1920) to the present day lively ball and the 19th century variations in pitching distance and number of bad pitches required for a base on balls cannot be eliminated. This means that the average pitching and fielding skill levels determined for pre-1920 seasons (and especially for the years prior to 1894) should be considered only as very approximate. In part, Cramer presented his findings in the form of a graph showing for each major league season since 1876 the change in BWA (Batter's Win Average) relative to the 1976 NL, his standard of reference. The BWA parameter is a very accurate measure of total batting effectiveness. Since BWA is proportional to runs created by a batter, or runs scored by a league, it can be used directly to compare the offense of batters or leagues between seasons: a change in BWA is proportional to a change in runs scored per game. If the 1976 NL batters scored runs at a given per game rate and this rate produced the 1976 league BWA for the NL, then any other season's BWA relative to the 1976 NL can be used to determine the change in runs scored per game that that season’s batters would have made against the 1976 NL pitching and fielding. However, we know from the statistical record exactly how many runs per game were made in that other season. The difference between this number and the predicted runs scored per game off the 1976 NL pitching and fielding can be taken as a measure of the difference between that year's Pitching and fielding (and rules, random factors, etc.) and those of the 1976 NL. For example, Cramer's graph Shows the 1900 NL to have a BWA correction factor of - .065 relative to the 1976 NL. The units of BWA are "winning runs per ten plate appearances" and it takes, on average, about ten additional runs for a team to win one additional game. Thus, an average 1900 NL batter would, if playing against the pitchers and fielders of the 1976 NL, create 1 - (10)(.065) = .350 runs for every run that an average 1976 NL batter would create against the same pitchers and fielders. League performance is synonymous with average player performance, so the 1900 NL batters, as a league, if performing against the 1976 NL pitchers and fielders, would score 35% as many runs per game as the 1976 NL batters would. The 1976 NL scored 7739 runs in 1944 team games, an average of 3.98 runs per game per team. The 1900 NL batters then, if opposed by the 1976 NL Pitchers and fielders, would score .35 x 3.98 = 1.39 runs per game. This difference, 3.98- 1.39 = 2.59 runs per game, reflects the difference in league batting skill between the 1900 NL and the 1976 NL; the 1900 NL batters are inferior by 2.59 runs per game. But in the actual play of the 1900 NL season, when they were facing the 1900 NL pitchers and fielders (and playing under 1900 rules and conditions), the 1900 NL batters scored at an average rate of 5.35 runs per game. Since the 1900 NL batters scored 5.35 runs per game in the 1900 NL and would theoretically predict to score 1.39 runs per game against the 1976 NL pitching and fielding (and under 1976 conditions), the difference of 5.35 - 1.39 = 3.96 runs per game is chargeable to the combination of 1900 NL pitchers and fielders being inferior to those of the 1976 NL and to the difference in baseballs, rules, playing conditions and so forth between 1900 and 1976. This amount, 3.96 runs per game by which the combined pitching, fielding and general conditions of the 1900 NL is inferior, can be approximately split into a Pitchers' share and a fielders' share; both of which will also carry the effect, in runs per game, due to differences in conditions between 1900 and 1976. The division into separate shares for pitchers and fielders is not exact because inferior (or superior) fielding will affect earned runs as well as unearned ones. The 1900 National League earned run average was 3.69; which means that 3.69 earned runs (assumed, as an approximation, to be the sole responsibility of the pitchers) were scored for every 5.35 total runs. And 3.69/5.35 = .690. Hence 69% of the 3.96 runs per game differential between the 1900 NL and the 1976 NL is assigned to the 2900 NL pitchers being inferior to the 1976 NL pitchers; .69 x 3.96 - 2.73 runs per game. The fielders share is 31% of 3.96, or 1.23 runs per game. These pitching and fielding differences can be converted back into changes in BWA relative to the 1976 NL. This will put the historical pitching and fielding changes on the same scale as Dr. Cramer employed for batters, making it easier to compare the three areas. In the conversion process, a negative sign indicates an inferiority to the 1976 NL reference. For batters, we know that a difference of -2.59 runs per game equals a -.065 BWA difference. Hence, a difference of 1.00 runs per game equals .0251 BWA. Thus, for the 1900 NL pitchers, the BWA change is -2.73 x .0251 = - .0685 BWA. And for fielders, the BWA change is - 1.23 x .0251 = -.0309. Both these 1900 NL changes, for pitchers and for fielders, include the effects of the pre-1920 dead ball and miscellaneous random factors. The influence of the latter can be removed (to a large extent) by averaging together the 1899, 1900, and 1901 NL BWA changes and treating this average value as the approximate difference in BWA for the 1900 NL relative to the 1976 NL. All major league seasons for the NL (except 1976, the defined reference), AL, and old American Association have been calculated in the above manner. The Union Association, Players League and Federal League seasons are computed as described, except that no averaging is done. All the results are shown on graphs similar to that used by Cramer for batters. As noted, the skill levels of pitching and fielding for pre-1920 seasons are only roughly correct; the validity of the post-1920 numbers is much greater. The pitching graph shows a 20-year decline in pitching skills from the initial level established during the first few seasons of the NL. This change is probably not due to any deterioration in inherent pitching ability but instead is the result of rules changes of that era such as a gradual reduction in the number of balls needed for a walk and the increasing of the pitching distance from an original 45 feet to 50 feet in 1881 (the season when the decline in pitching skills began in earnest) and subsequently to 60 feet 6 inches in 1893. Increase the pitching distance and all pitchers, even though they have not lost any of their inherent physical skills, will be less effective when measured by runs per game. This illustrates why the 19th century results must not be viewed as anything more than very approximate. From the mid- 1890's there is a generally rising trend until the introduction of the lively ball in 1920 again caused pitchers to yield more runs per game. Thereafter, another upward movement began and has continued, except for the peak years of World War II, up to the present. On the fielding side, there has been a dramatic and nearly continual overall improvement. A large part of this, especially in the early years, is likely the result of improved baseball gloves and better kept playing fields. Nevertheless, fielding over the past decades, in conditions of modern gloves and groundskeeping, also shows a fairly steady improvement. Overall, the BWA differences in pitching relative to the 1976 NL are of comparable magnitude to the BWA batting differences found by Cramer. This means that, over the years, the improvements in batting and pitching have been similar; which is not unreasonable. Also, there are no large drops in fielding in 1920 or 1893, years when pitching skills declined. This suggests that the method for breaking the overall changes of pitching plus fielding into separate components is not subject to large errors. |

 Average Pitching & Field Skills
